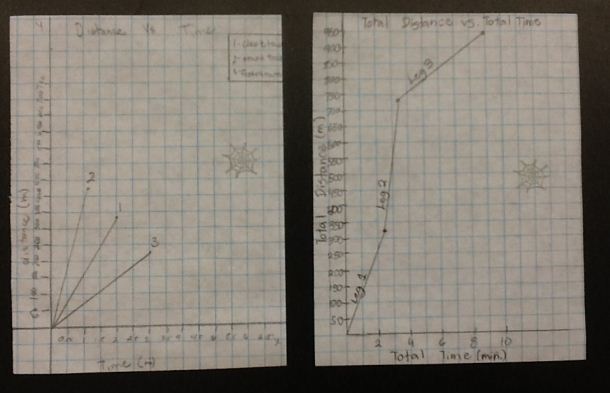
From our data we graphed the sunny day walk.
The first graph below shows the three different legs of our journey. Leg 2 is the faster leg and so the line is steeper than the other legs.
The second picture show the whole journey from start to finish. A total of 946m and a time of about 8 minutes depending on your group. you can still see the separate legs of the journey but this time you see the whole journey one 1 graph.
| 2013-02-11_graphing_the_sunny_day_walk.pdf |
 RSS Feed