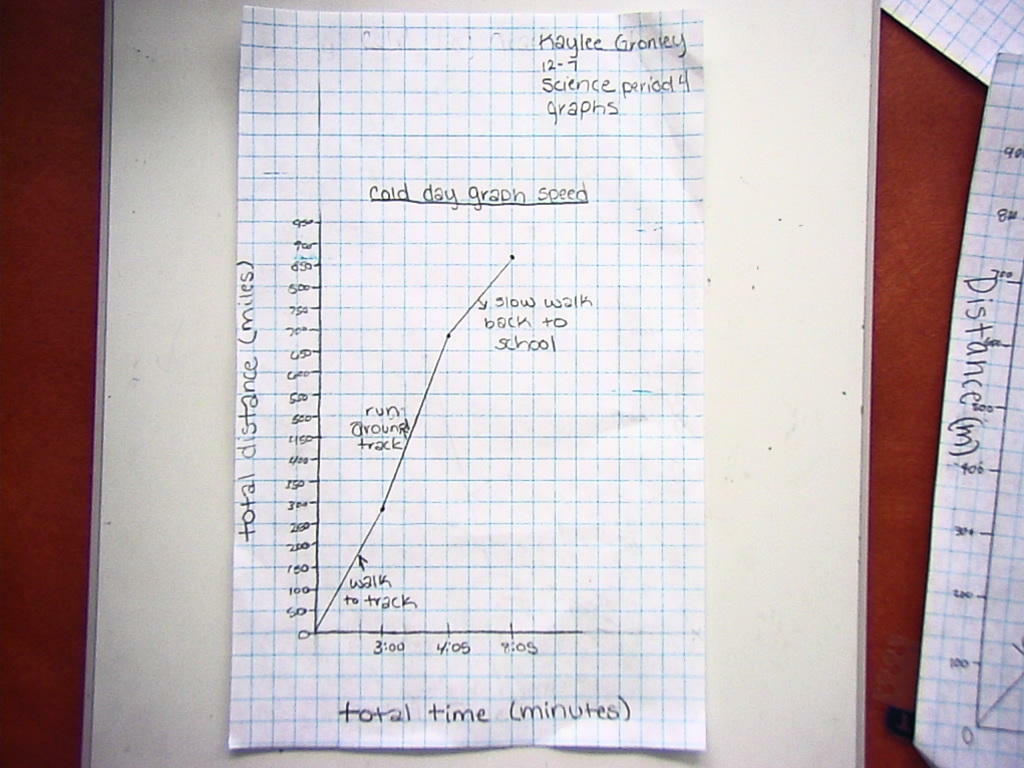
Today we used the data from the cold walk to make a graph that represented the journey we too. Each leg of the journey on the graph shows a different speed. the steeper the line on the graph the faster the leg of the journey.
Using this graph what was the fastest leg of our journey?
Using this graph what was the fastest leg of our journey?
| 12-07_cold_day_motion_graph.pdf |
 RSS Feed