I know we were not going to write a discussion but the results were so fabulous that we had to talk about them!
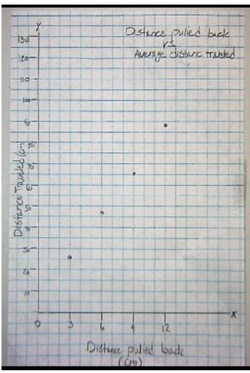
We noticed that teams who had data like the one on the picture , made a great attempt to control as many variables as possible! The graph line shows a direct, positive relationship between the distance the roadster is pulled back and the distance the roadster travels.
For the second half of class I presented you with a couple of problems that could only be solved by knowing how long a journey took.
Please note that I have not attached a pdf today as the ActivInspire program did not want to cooperate with me.
 RSS Feed