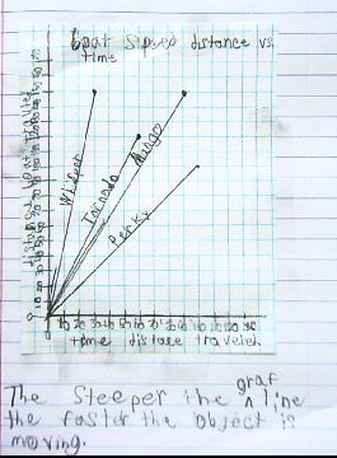
Today we made final observations about the speeds of the 4 boats. Hopefully you all made the connection between the steepness of the graph line and the speed of the boat on a distance V time graph.
The steeper the line the faster the object moves.
The second half of class was spent in the computer lab getting ideas for the science fair. Please look at my Science Fair tab on this website for ideas.
The steeper the line the faster the object moves.
The second half of class was spent in the computer lab getting ideas for the science fair. Please look at my Science Fair tab on this website for ideas.
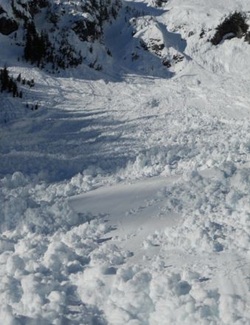
This avalanche moved at the slow speed of 15km/hr. What does this tell you about the slope of the mountain?
| 2013-02-06_speed_graphs_and_project.pdf |
 RSS Feed